I have been using the Open Energy Monitor’s content management system (emoncms) for at least the last 10 years to log and monitor various sensors around my house. The software is brilliant in my view, however Home assistant is slow taking over with all the new energy monitoring dashboards, etc. I think if I was to start again, I would run everything from Home Assistant. Currently I run home assistant mainly for control.
As a hardware person, I would always design and build my own sensors that would talk W-Fi directly to my local emoncms running on a beaglebone (Now a raspberry pi). I now have hundreds of data points coming in from all different types of resource monitoring and environmental sensors. Water, Electricity, Temperature, Humidity, Tank Levels, CO2, PM2.5, PM10 and much more as it’s always expanding. All the data can be displayed on the normal emoncms dashboards, however I wanted a basic real-time display in the kitchen that I could just look at.
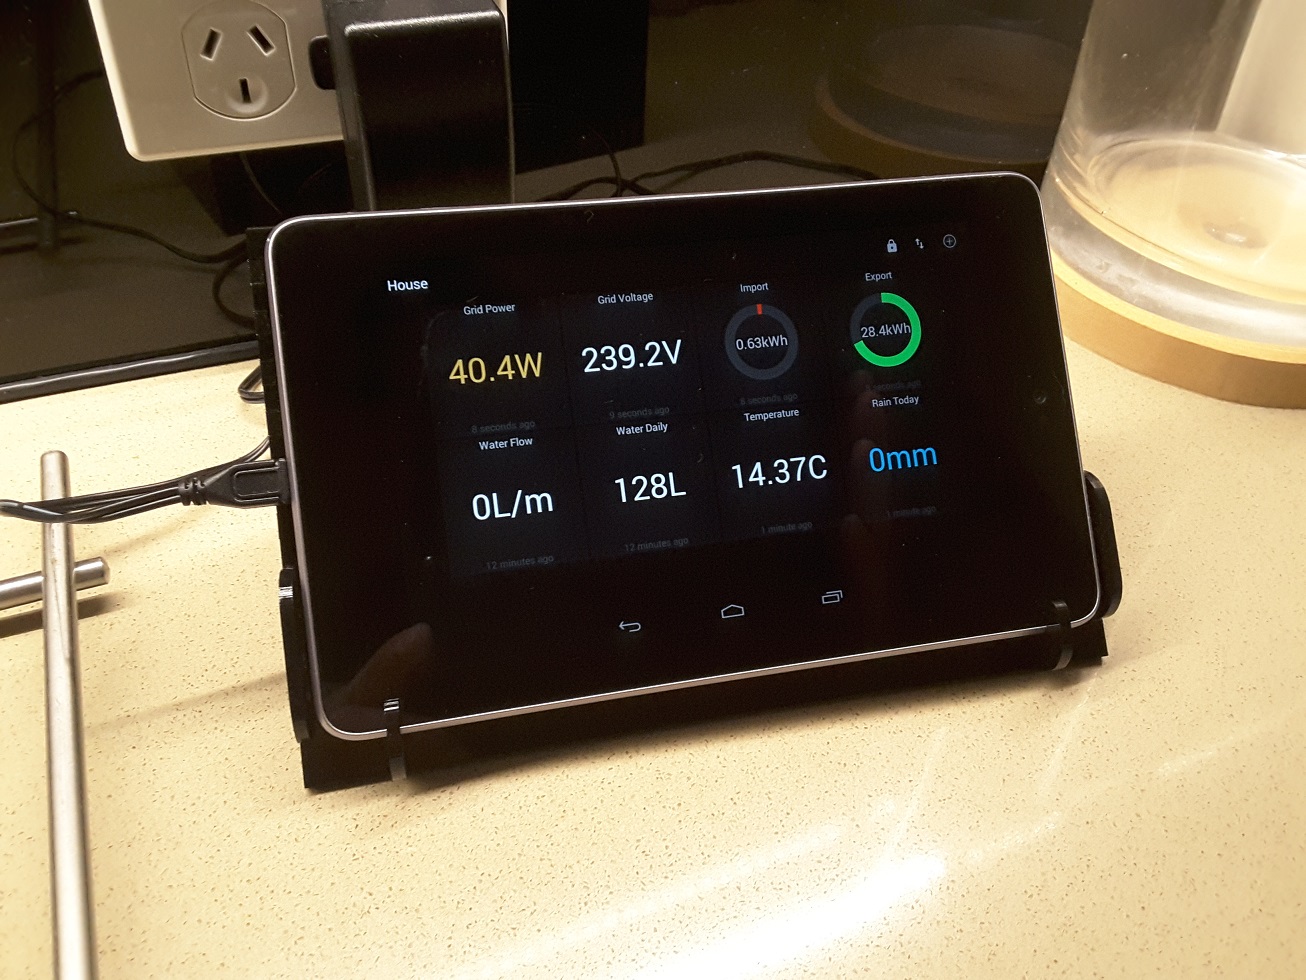
As I can pull the data from emoncms via MQTT, you can download apps to make dashboards. That is all I have done here using MQTT Dash. The main screen displays Grid Power, Grid Voltage, Grid Import for today, Grid export for today, Mains Water Flow, Water usage for today, outside temperature and rain fall since 9am.
This is a great way for me to understand my electricity and water usage in real time. As a household with solar panels, I can save money by using my own energy directly from my solar panels during the day. The goal is bring the imported energy (Energy from the grid into your home) down to the lowest possible. I have now achieved very low imports with some smarts and automations throughout the house. Personal habits also help with using large items like vacuum cleaners, heating, cooling and the washing washing mostly only during the day. I still have to cook tea and live in comfort, but little changes can make big impacts over time!
During the day when I’m ready to run large usage items, I can look over to the display and check the grid power value. When the grid power value is negative, I’m exporting power to the grid and only getting a low Feed in Tariff (FIT) for it. This is when I can turn on items to use more of my own power. If the grid power value is positive like in the photo below, I’m importing power from the grid and therefore want to get this value as small as possible, so I can delay using electrical items.
I fitted a 6.6KW solar system a few years ago. This is much bigger than I need for a well insulated standard home, but the goal was to have a EV (Electric Vehicle) by now. This shouldn’t be long now!
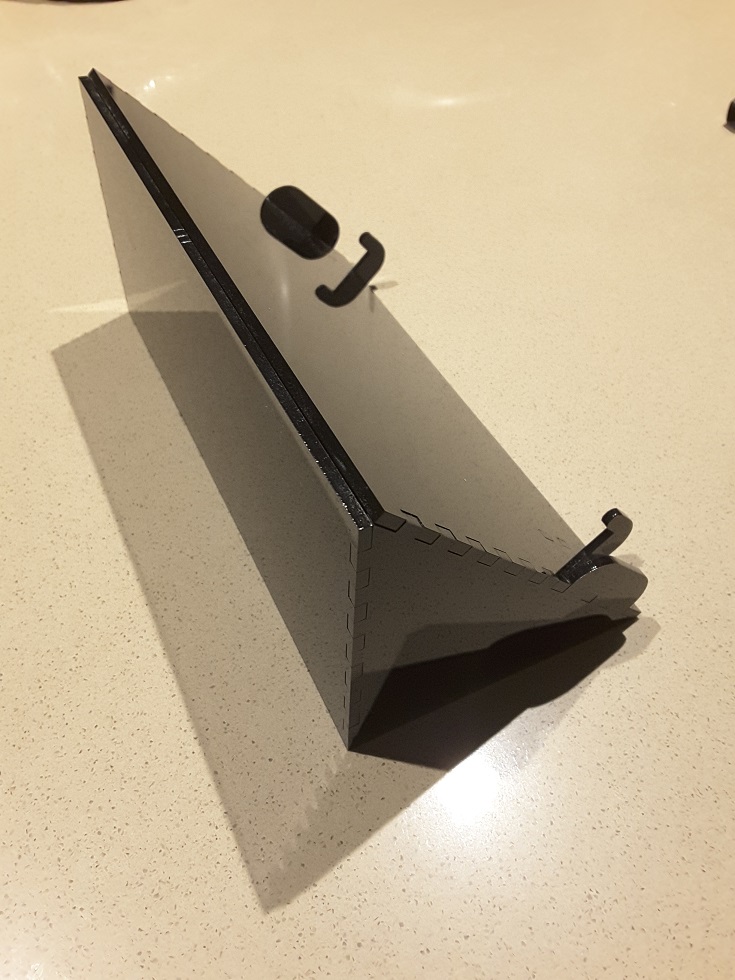
The acrylic laser cut stand was made at the local makerspace in Adelaide. They have lots of cool equipment like 3D printers, laser cutting, CNC routers, woodworking, metal working. You simply sign up for membership and go in and use the equipment. Volunteers are onsite to help you with your project and how to use the equipment.
Battery Management
Tablet and laptop makers want to achieve the the longest battery run time. That’s a selling point and what people want, however this can reduce the battery life to only a few years in always on applications. Lithium batteries do not like to remain fully charged for long periods of time. To increase the battery life and reduce the chances of the lithium battery swelling, there are apps that allow you to control the battery charging profile with the goal to only charge to 80%, etc. On Android this requires that your tablet or phone has been rooted. Check out Battery Charge Limit. In my case this does not work on my Google Nexus 7 (2012) pictured above.